Single-Family Permits Down 17% Year-to-Date, but Local Filings Tell a Different Story
TallahasseeBusinessNews.com | By Brian French | Published September 3, 2026 | Data through July 2026
This is the first edition of the Tallahassee Permit Tracker, a monthly Florida Authority Network series that assembles federal, county, and city permit data into one reconciled view of homebuilding in Florida’s Capital region. Updated each month after the U.S. Census Bureau’s Building Permits Survey release.
Quick Answer
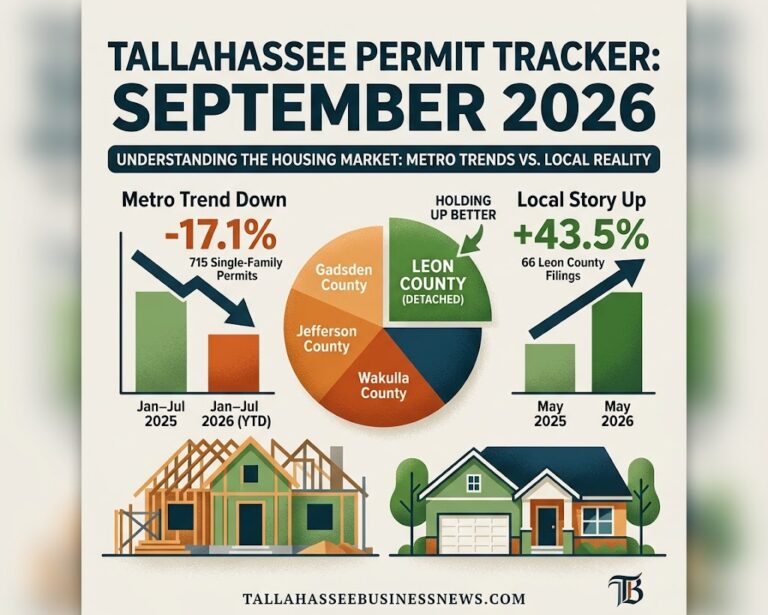
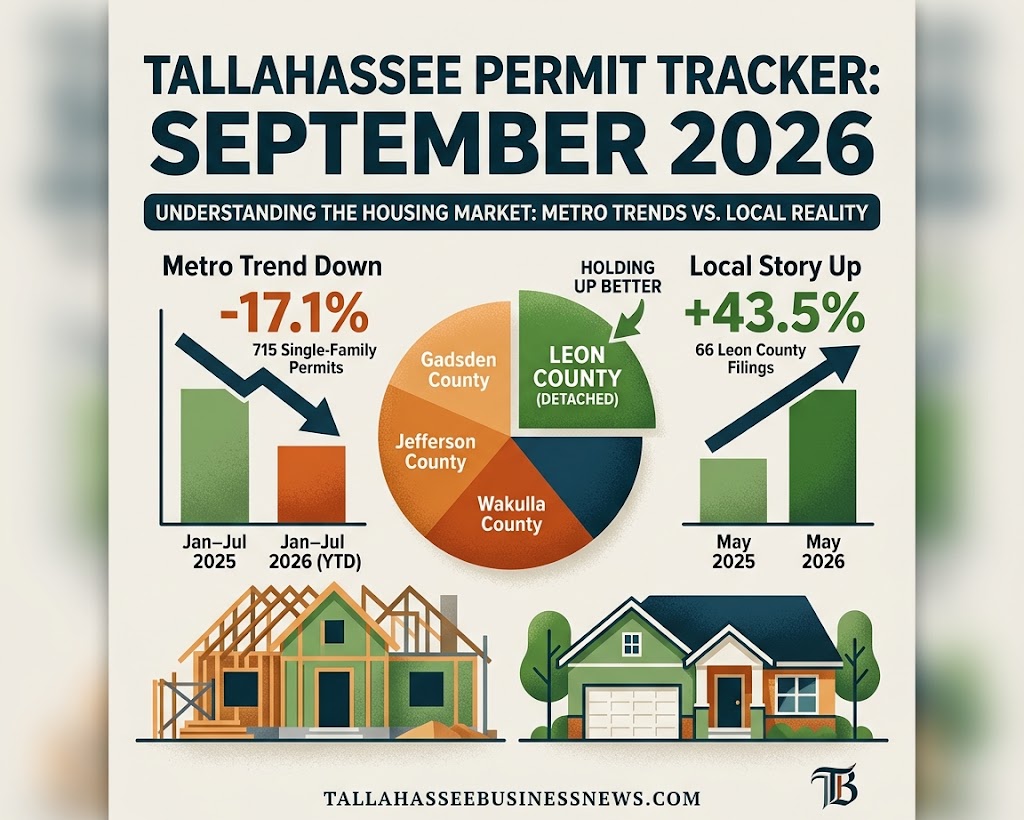
How many new homes are being permitted in Tallahassee? The Tallahassee metro area (Leon, Gadsden, Jefferson, and Wakulla counties) was authorized to build 100 single-family housing units in July 2026, down 20% from 125 in July 2025, according to U.S. Census Bureau data released August 25, 2026. Year-to-date through July, the metro has permitted 715 single-family units, a 17.1% decline from 863 over the same period in 2025. On a trailing 12-month basis, permits total 1,138 units versus 1,348 a year earlier (-15.6%). Locally reported Leon County filings, however, showed strong spring gains — up 43.5% in May — highlighting a measurement gap this tracker is designed to reconcile.
The Numbers at a Glance
| Metric | Latest | Prior Year | Change |
|---|---|---|---|
| July 2026 single-family units (MSA) | 100 | 125 | -20.0% |
| June 2026 single-family units (MSA) | 113 | 125 | -9.6% |
| Q2 2026 (Apr–Jun) | 300 | 376 | -20.2% |
| Year-to-date (Jan–Jul) | 715 | 863 | -17.1% |
| Trailing 12 months (Aug ’25–Jul ’26) | 1,138 | 1,348 | -15.6% |
| Leon County filings, May 2026 (local count) | 66 | 46 | +43.5% |
Sources: U.S. Census Bureau Building Permits Survey via FRED (series TALL212BP1FH); Leon County and City of Tallahassee filings as reported by Tallahassee Reports. See Methodology.
What the Data Shows
The metro trend has turned down since last summer
The federal series is unambiguous about direction. After a steady run of 125-plus units per month from February through July 2025, metro permits dropped to 86 in August 2025, cratered to 48 in November 2025 — the lowest single month since the 2012 recovery — and have only partially rebounded in 2026. Through July, 2026 has averaged 102 units per month against 123 per month over the same span in 2025.
Monthly single-family units authorized, Tallahassee MSA
| Month | 2023 | 2024 | 2025 | 2026 |
|---|---|---|---|---|
| January | 86 | 125 | 90 | 92 |
| February | 81 | 127 | 140 | 112 |
| March | 142 | 139 | 132 | 111 |
| April | 102 | 126 | 125 | 98 |
| May | 130 | 136 | 126 | 89 |
| June | 120 | 110 | 125 | 113 |
| July | 127 | 131 | 125 | 100 |
| August | 103 | 111 | 86 | — |
| September | 123 | 90 | 103 | — |
| October | 158 | 106 | 109 | — |
| November | 123 | 88 | 48 | — |
| December | 128 | 90 | 77 | — |
| Full year | 1,423 | 1,379 | 1,286 | 715 YTD |
Source: U.S. Census Bureau, retrieved from FRED, Federal Reserve Bank of St. Louis.
Three consecutive annual declines are now on the board: 1,423 units in 2023, 1,379 in 2024, 1,286 in 2025. If the second half of 2026 merely matches the weak second half of 2025 (548 units), the year would finish near 1,260 — roughly flat with 2025 and the lowest annual total since 2020.
The long view: still far below the 2005–2006 peak
For context, the Tallahassee metro authorized 2,557 single-family units in 2006 at the height of the last housing cycle and just 548 in 2011 at the bottom. Today’s run rate of roughly 1,150–1,300 units per year sits almost exactly at the midpoint of that range — a market that has recovered from the bust but never returned to boom-era production, despite the metro’s population growing by tens of thousands of residents since then.
Why the local numbers look better than the federal numbers
This is the tracker’s central finding and the reason a reconciled series is needed.
Locally compiled counts published by Tallahassee Reports, drawn from City of Tallahassee and Leon County filings, showed 66 single-family permits in May 2026 versus 46 in May 2025 (+43.5%), and the three-month average for March–May rising 32% year-over-year. The same source reported March 2026 at 58 permits (+26.1%) and a year-to-date count of 259 through May, trailing 2025’s 301.
The Census series for the same May reported 89 units metro-wide, down from 126 — a decline of 29%.
The two series cannot be directly compared, and the gap is not an error. It reflects three structural differences:
- Geography. The Census figure covers four counties. The local count covers Leon County only (city plus unincorporated county).
- Unit of measure. The Census counts housing units authorized, which includes attached single-family townhouses each counted as a unit. Local tallies typically count permits issued for detached single-family homes.
- Timing. Census data is reported by permit-issuing jurisdictions on a survey schedule and is subject to revision; local reporting captures filings as they appear in the county and city portals.
The practical takeaway: Leon County’s detached-home market appears to be holding up better than the broader four-county metro, where townhome and outlying-county activity has slowed. The tracker will monitor whether the two series reconverge in the August and September data.
Permit values are rising even as counts fall
Local filings show the three-month average monthly permit value rose from $13.1 million in May 2025 to $13.9 million in May 2026, a 6.1% increase, according to Tallahassee Reports. Fewer, more expensive homes is the pattern — consistent with a market where land and construction costs are pushing builders toward higher price points rather than volume.
What It Means for Tallahassee Business
For builders and subcontractors: The metro is on pace for roughly 1,250 single-family starts this year. Firms that budgeted for 2023-level volume (1,400+) should plan for 10–12% less work across the region, with Leon County proper the relative bright spot.
For real estate professionals: Constrained new supply supports resale pricing. The Tallahassee MSA posted modest gains in home prices and sales in May 2026, and a thinner new-construction pipeline through 2027 makes a supply-driven price correction unlikely.
For lenders and suppliers: Rising permit values with falling counts means larger average loans and material orders per project — fewer customers, bigger tickets.
For local government: Permit revenue and impact-fee collections track counts, not values. A 15–20% unit decline flows directly into Growth Management and DSEM budgets.
Brian’s Take
Permits are the earliest reliable signal in the housing chain — they lead starts by a month, completions by nine to twelve, and closings by more than a year. Right now that signal is flashing yellow for the four-county metro and closer to green for Leon County itself. The 48-unit November 2025 print was not a data glitch; it was the moment builders pulled back after a summer of high rates and rising insurance costs, and the 2026 recovery has been partial. My read: expect the metro to finish 2026 between 1,200 and 1,300 units, the third straight annual decline, with Leon County detached homes outperforming. The number to watch is August, released September 25. If it prints above 110, the spring rebound was real; if it prints in the 80s again, second-half 2026 will look like second-half 2025. Either way, this tracker will have the number the day it drops.
Frequently Asked Questions
How many single-family building permits did Tallahassee issue in 2025? The Tallahassee metropolitan area was authorized to build 1,286 single-family housing units in 2025, down from 1,379 in 2024 and 1,423 in 2023, according to U.S. Census Bureau data.
Is homebuilding in Tallahassee increasing or decreasing? Decreasing at the metro level. Single-family permits are down 17.1% year-to-date through July 2026 and down 15.6% on a trailing 12-month basis. Leon County–only filings showed spring increases, suggesting detached-home construction inside the county is holding up better than the surrounding counties.
What counties are in the Tallahassee metro area for permit data? Leon, Gadsden, Jefferson, and Wakulla counties make up the Tallahassee, FL Metropolitan Statistical Area used by the Census Bureau.
Where do I look up building permits in Tallahassee? City permits are filed through the City of Tallahassee Growth Management Department; unincorporated Leon County permits go through the Department of Development Support and Environmental Management (DSEM). Both are searchable through the joint TLCPermits.org hub and the Leon County Accela Citizen Access portal.
What was the peak year for Tallahassee homebuilding? 2006, when the metro authorized 2,557 single-family units. The trough was 2011 at 548 units.
When is the next Tallahassee permit data release? The Census Bureau’s next Building Permits Survey release covering August 2026 is scheduled for late September 2026. The Tallahassee Permit Tracker will publish its October edition within days of that release.
Methodology
The Tallahassee Permit Tracker assembles three public data streams:
- U.S. Census Bureau Building Permits Survey, series TALL212BP1FH (single-family, not seasonally adjusted) for the Tallahassee MSA, retrieved via FRED. This is the primary series for year-over-year and multi-year comparisons because it is consistent back to 1988.
- Leon County and City of Tallahassee permit filings, as compiled monthly by Tallahassee Reports from the TLCPermits and Accela portals. Used for county-level detail and permit valuation.
- Tallahassee-Leon County Office of Economic Vitality interactive data center, which publishes a new single-family construction permit dashboard among its 80-plus tracked metrics.
Year-to-date, quarterly, and trailing-12-month totals are calculated by Florida Authority Network from the monthly Census observations. Percent changes are rounded to one decimal. Census figures are subject to revision; this tracker will note material revisions in subsequent editions. FAN does not independently verify individual permit records.
Sources and Resources
- U.S. Census Bureau, New Private Housing Units Authorized by Building Permits: 1-Unit Structures for Tallahassee, FL (MSA), retrieved from FRED, Federal Reserve Bank of St. Louis — https://fred.stlouisfed.org/series/TALL212BP1FH
- U.S. Census Bureau Building Permits Survey — https://www.census.gov/construction/bps/
- Tallahassee Reports, “Leon County Single Family Residential Permits Up 43.5% in May,” June 15, 2026 — https://tallahasseereports.com/2026/06/15/leon-county-single-family-residential-permits-up-43-5-in-may/
- Tallahassee Reports, “Leon County Residential Construction Permits Rebound in March,” April 6, 2026 — https://tallahasseereports.com/2026/04/06/leon-county-residential-construction-permits-rebound-in-march/
- Tallahassee-Leon County Office of Economic Vitality, New Single-Family Construction Permits data — https://oevforbusiness.org/data-center/interactive-data/new-single-family-construction-permits/
- Tallahassee-Leon County Permit Portal (TLCPermits) — https://www.tlcpermits.org/
- Leon County Permits Online (Accela Citizen Access) — https://aca-prod.accela.com/LEONCO/Default.aspx
- City of Tallahassee Growth Management, Residential Building Permits — https://www.talgov.com/growth/gm_permits_lues/Residential_Building_Permit_7
- Tallahassee-Leon County Construction Trends story map (10-year permit series) — https://storymaps.arcgis.com/stories/0bc18f6366c840609a8fb4332e84219c
Related coverage across the Florida Authority Network: FloridaRealEstateNews (statewide permit trends), FlFinancialNews (construction lending), TampaBayBusinessNews and JacksonvilleBusinessNews permit trackers.
About the Author